Construction Data Analytics for Productivity: Turning Site Data into Actionable Insights
Unlock project efficiency with construction data analytics for productivity. Turn raw site data into actionable insights to eliminate bottlenecks & boost pro...
by Sophia Bennet
|
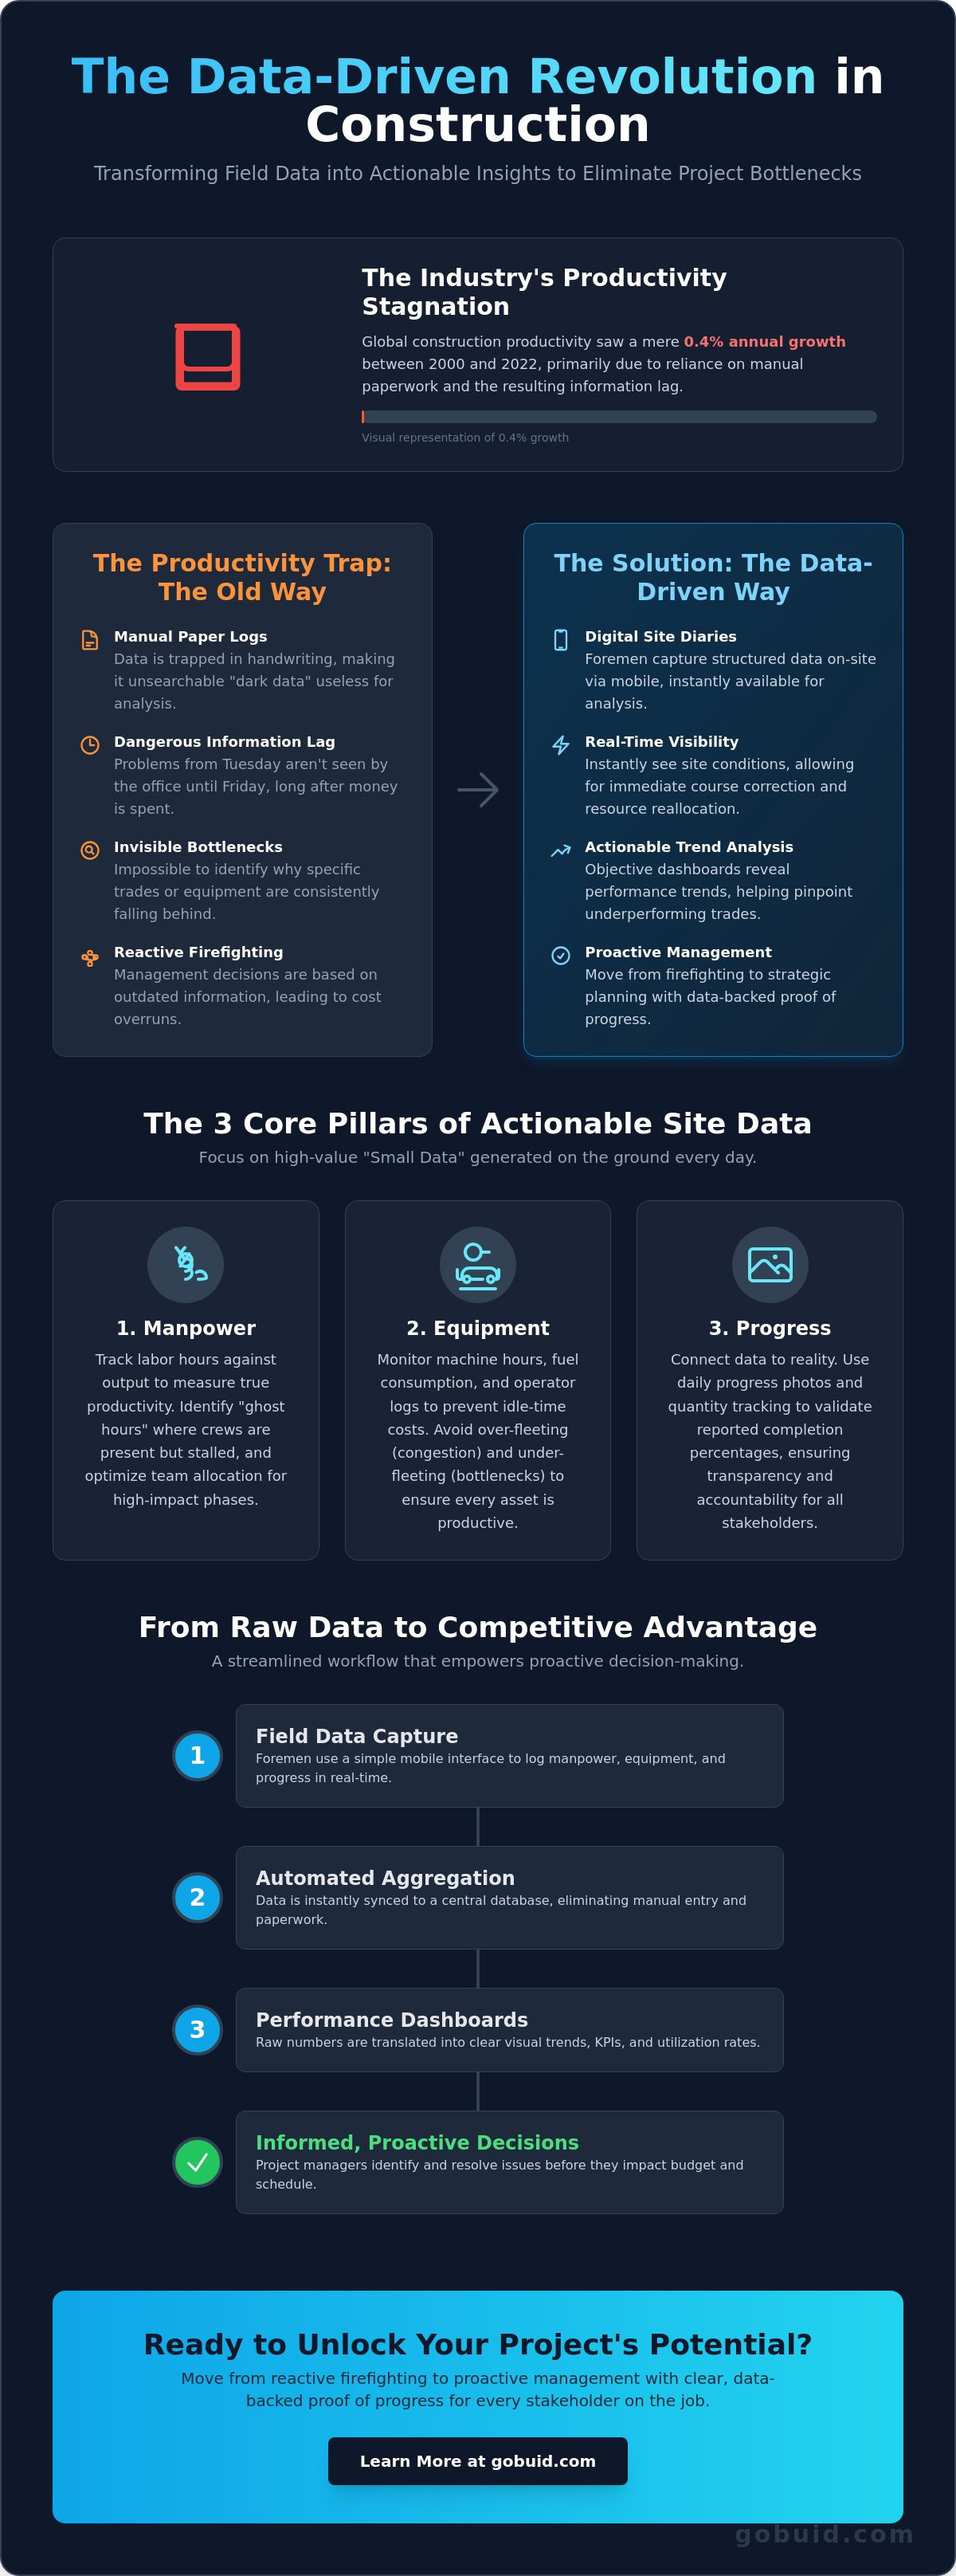
Global construction productivity grew by just 0.4% annually between 2000 and 2022, despite trillions in global spending. This stagnation often stems from a simple reality: site teams are drowning in manual paperwork that never gets analyzed. You know the frustration of the information lag between the field and the office. It's nearly impossible to identify why specific trades are falling behind when your data is trapped in a filing cabinet or a static spreadsheet.
Leveraging construction data analytics for productivity is the professional solution to bridge this gap. You'll learn how to transform daily field data into actionable insights that eliminate bottlenecks and optimize resource allocation. This article outlines a streamlined approach to monitoring project health at a glance while reducing administrative time for your foremen. We'll show you how to move from reactive firefighting to proactive management with clear proof of progress for every stakeholder on the job; for those managing specialized site work, JBM Custom Contracting provides the professional property maintenance and demolition services needed to keep projects moving forward efficiently.
Key Takeaways
- Eliminate the information lag between the field and the office by converting daily site observations into real-time performance trends.
- Identify the critical KPIs and utilization rates needed to pinpoint exactly why specific trades or machinery are falling behind.
- Learn how to leverage construction data analytics for productivity to bridge the gap between physical site reality and digital precision.
- Streamline your workflow by replacing manual paperwork with automated dashboards that provide a clear view of project health.
- Reduce administrative burdens for foremen while providing stakeholders with transparent, data-backed proof of progress.
The Foundation: How Field Data Powers Construction Productivity
Construction data analytics for productivity is the process of converting daily site observations into performance trends. It moves beyond the abstract idea of "Big Data" and focuses on the high-value "Small Data" generated on the ground. By capturing specific inputs, teams can measure Productivity more accurately than traditional methods allow. This systematic approach identifies three core pillars of site data: Manpower, Equipment, and Progress.
Traditional paper logs create a dangerous information lag. When data stays on a clipboard, it's invisible to the office until the end of the week. This lag silently erodes project profitability. You can't fix a problem you can't see until after the money is spent. Transitioning to digital data points allows for instant aggregation and total transparency across the project team; this commitment to transparent project tracking is a key practice for professional renovators like BCR Basements, who prioritize clear communication and regulatory compliance.
To better understand how these techniques apply to project management, watch this video:
From Manual Logs to Digital Data Points
Manual site diaries are often "dark data." This information is trapped in handwriting that can't be searched, filtered, or analyzed. It's essentially useless for forecasting. Modern Digital Site Diaries solve this by capturing structured data points directly from the field. Foremen record events through a mobile interface, which automatically aggregates the information into a central database. This happens without increasing their administrative workload, ensuring that field-to-office communication is both accurate and immediate.
Real-Time Visibility: Eliminating the Information Lag
Waiting for Friday to review site reports is a reactive strategy that invites cost overruns. Real-time visibility is the ability to make corrective decisions while work is still in progress. It allows project managers to see site conditions as they happen. If a specific trade falls behind on Tuesday, you know by Tuesday afternoon. You can reallocate resources or adjust schedules immediately. This immediacy turns raw data into a measurable competitive advantage, ensuring every project stays on the path to high-quality execution—a standard upheld by specialist providers like Pergola2Go in the outdoor construction sector.
Turning Raw Site Data into Actionable Productivity Metrics
Raw numbers mean nothing without context. To reverse the long-term decline in construction sector productivity, you must translate daily logs into specific performance metrics. Construction data analytics for productivity relies on tracking output against labor hours. This allows you to see exactly how much value each hour generates. Progress photos provide the visual proof required to validate these data-driven claims, ensuring that reported completion percentages match the physical reality on-site.
To capture these progress photos with greater precision and scale, project managers often explore Aerial Filming and Photography to provide a comprehensive, bird's-eye view of the entire site.
Effective Equipment Management prevents idle-time costs that bleed budgets dry. By tracking machine hours alongside fuel consumption and operator logs, you can identify which assets are underperforming. If a crane sits idle for 30% of the shift, your schedule is likely inefficient. Using a structured Equipment Management system ensures every piece of heavy machinery earns its keep. It turns a potential liability into a predictable asset.
Tracking Manpower and Equipment Utilization
Utilization rates reveal "ghost hours" where labor is clocked in but stalled by delays. These ghost hours represent a significant loss in momentum. They often occur when crews are present but cannot work due to site constraints or poor sequencing. Analytics help you determine if you have the right amount of equipment on-site. Over-fleeting leads to site congestion and wasted rental costs, while under-fleeting creates critical bottlenecks. You can optimize your roster by reviewing Manpower Tracking data to ensure peak efficiency during high-impact phases; if your data indicates a need for more specialized teams, you can post a job in Savannah GA to find qualified local talent for projects in that region.
Identifying Bottlenecks with Trend Analysis
A unified Project Analytics Dashboard reveals which trades consistently fall behind schedule. Instead of relying on anecdotes, you see objective performance trends over weeks or months. This historical data is essential for setting realistic "stretch goals" for your crews. By analyzing past performance, you can identify your most productive days and use those as a benchmark for future planning. This grounds your expectations in reality rather than optimism. You can even generate a report in one click to keep your stakeholders informed without extra paperwork.
Implementing a Data-Driven Workflow Without the Administrative Burden
Implementation fails when the process is too complex. You don't need a team of analysts to gain the benefits of construction data analytics for productivity. The first step is replacing fragmented forms with a unified mobile-first capture tool. This ensures site data is structured from the moment of entry. Once captured, automate the aggregation of daily logs into high-level dashboards. This eliminates manual data entry and provides an immediate view of project health; for example, specialized concrete contractors often use these insights to manage complex slab and paving schedules, and you can learn more about Born Integrated Construction to see these principles in action.
The workflow must prioritize speed. Use "One-Click" reporting to keep stakeholders informed without extra typing. This keeps the office and the field in sync at all times. Finally, conduct weekly "Data Reviews" to adjust resources based on actual output. These reviews turn data into a reliable management tool that guides your next moves on-site. This four-step process transforms raw site data into a measurable competitive advantage without adding hours to your week; to see how these professional standards translate to physical site work, discover WillsByrne Construction & Landscaping LTD and their commitment to quality execution.
One-Click Reporting: Closing the Feedback Loop
The operational value of generating reports in one click cannot be overstated. It removes the friction between identifying a site event and documenting it for stakeholders. Professional, data-backed reporting builds immediate trust with owners and architects. When everyone sees the same facts, dispute resolution time drops significantly. You provide a clear, professional paper trail that protects your firm and proves your progress.
Building a Culture of Transparency and Accountability
Transparent data motivates crews. When performance is visible, teams naturally maintain higher standards. Position the Mission Control view as a tool for empowerment. It's not about micromanagement. It's about providing the field team with the same high-level insights the office possesses. This shared perspective fosters a unified team committed to high-quality execution. By integrating construction data analytics for productivity into your daily routine, you create a professional environment where accountability is built into the workflow.
Master Your Site Performance Today
Turning site data into actionable insights is the only way to break the cycle of stagnant productivity. You've seen how digital logs eliminate the information lag and how tracking utilization rates uncovers hidden costs. By following a structured, data-driven workflow, you move from reactive troubleshooting to proactive leadership—a transition that often begins with a solid operational strategy created through tools like GrowthGrid. Mastering construction data analytics for productivity ensures your projects remain profitable and your stakeholders stay informed with objective proof of progress.
While digital systems streamline your operations, maintaining a professional presence in person is equally vital for leadership; to enhance your professional confidence for stakeholder meetings, discover GLI GLI and their professional-grade whitening solutions.
Efficiency doesn't have to be complicated. You can gain immediate visibility into your manpower and equipment without adding to your team's administrative burden. It's time to replace guesswork with a Project Analytics Dashboard that reflects the reality of your site in real time. You can even generate professional reports in one click to keep everyone on the same page. To reward this efficiency and build stronger team bonds, many managers also use digital platforms like Gameznights to host interactive games nights for their crews.
Streamline your project analytics with GoBuid; start for free today. With no lock-in contracts, you can begin optimizing your resource allocation and driving measurable gains on every project right now. Build with confidence and regain control over your workflows.
Frequently Asked Questions
What are the most important construction productivity metrics to track?
The most critical metrics include labor productivity, measured as output per man-hour, and equipment utilization rates. You must also track the ratio of planned versus actual progress to identify schedule slippage early. Monitoring these specific KPIs allows you to pinpoint exactly where resources are being wasted and which trades require additional support to meet project milestones; this commitment to accuracy and detail is a hallmark of excellence, whether in large-scale infrastructure or the intricate assembly of narrow-gauge scale models from Narrow Minded Railworks.
How does construction data analytics help reduce project costs?
Construction data analytics for productivity reduces costs by identifying idle time and resource bottlenecks before they lead to expensive overruns. Real-time visibility allows you to make corrective decisions while work is still in progress, preventing the need for costly weekend overtime. This proactive management style minimizes waste and ensures that every man-hour and machine-hour contributes directly to the bottom line; similarly, auditing your fixed overheads through Green Compare can help you secure better commercial utility and finance rates to further protect your profits.
Can I use data analytics on small-to-mid-sized construction projects?
Data analytics is often more vital on smaller projects where profit margins are thinner and errors are more difficult to absorb. Small-to-mid-sized contractors benefit from automated dashboards because they provide high-level oversight without the need for a dedicated data analyst. For example, specialized contractors can explore Residential Roof Reports to streamline their estimation process with digital precision. Using such digital systems ensures that your smaller crew spends more time building and less time managing manual paperwork or searching for lost documentation.
How do I get my field crew to adopt digital data collection tools?
The key to adoption is providing a tool that is significantly faster and easier than the paper diaries they currently use. Focus on mobile-first solutions that offer one-click report generation to reduce the foreman's administrative burden. When the crew realizes that digital tools eliminate repetitive typing and provide instant proof of their progress, they'll naturally favor the more efficient digital workflow.
